Visual Carbon's Gallery

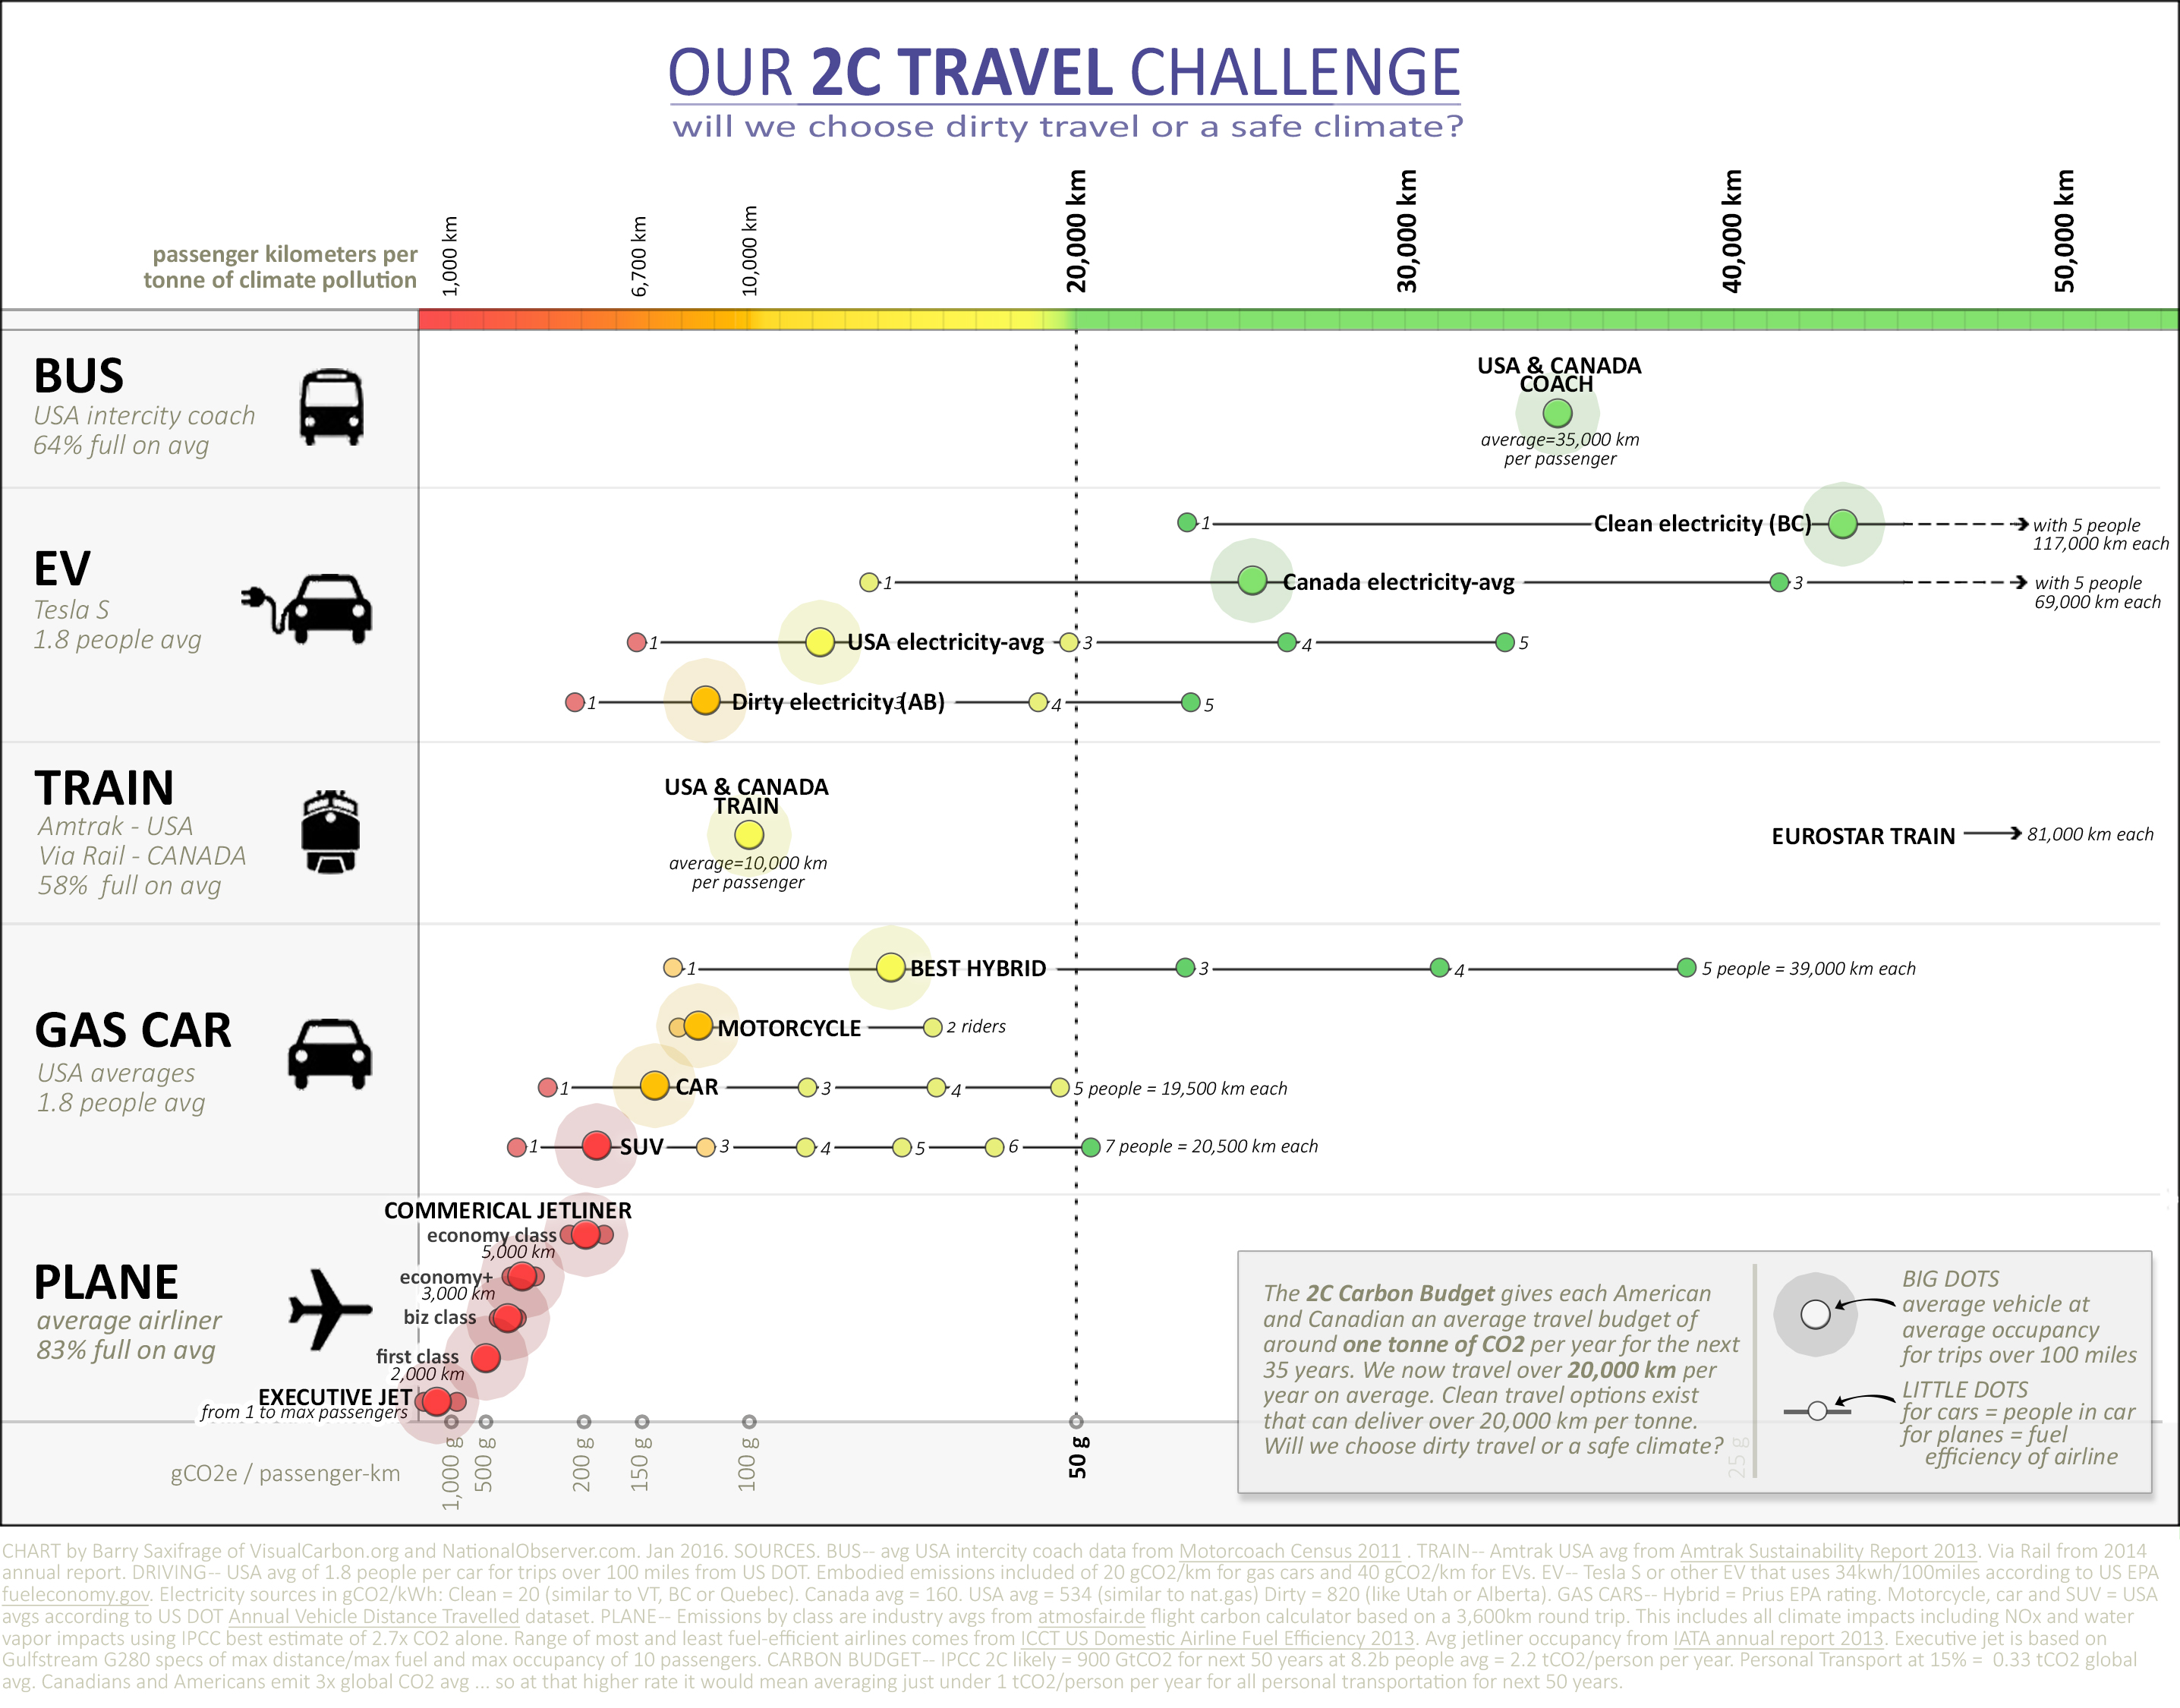
Trains, Planes, Cars and Buses. This chart shows how far a passenger can travel per tonne of climate pollution. For cars a primary factor is how many seats are filled. For electric vehicles it also depends greatly on how clean the electricity supply is. Canada's share of the 2C carbon budget is big enough for an annual average of around one tonne per Canadian for all personal transport for the next 50 years. And currently we travel around 20,000km per capita per year. This chart gives a sense of which technologies and occupancy levels are 2C compatible for long distance travel.
READ ARTICLE : : PRINT VERSION : : USA VERSION
READ ARTICLE : : PRINT VERSION : : USA VERSION
1st November 2017 · by Barry Saxifrage